tkprof: When and How To Use It

As an Oracle specialist you’ve probably heard of SQL Trace and it’s brother tkprof. SQL Trace generates a low level trace file that has a complete chronological record of everything a session is doing and waiting for when it “talks” to the database. TKPROF on the other hand takes that trace file and aggregates all of the low level details in an easy to read report. This report can then be quickly analyzed to find the root cause of the slow performance.

There are a lot of samples online showing the use of TKPROF in a lab environment. But I haven’t seen one that actually shows you a real use-case similar to what you’ll face on your job. So instead of giving you all possible options of turning on SQL Trace and all possible flags TKPROF utility accepts I’ll show you exactly how and when I use it with a real example. Sounds good?

When Not To Use TKPROF

First, lets cover when TKPROF is not a good option. Do not use TKPROF to analyze short lived sessions that are typical on a very busy website. You are much better off looking at ASH Monitoring. It’s because only ASH can give you an aggregated view across all sessions and what they are waiting for. It can also pin point the SQL_ID across all of these sessions that is generating the most I/O waits. So use ASH when you are troubleshooting a performance problem that is across 99% of all sessions in the database. An example of this would be when you get a call from your dev-ops team saying that their response time from the database has gone up substantially in the last 15 minutes.

What TKPROF is Good For

My #1 use-case for TKPROF is when I am tracing a bad performing batch job. Batch jobs work on a large set of data either looping over each record or performing a set operation on all of them. And for this reason a batch job is usually long running and a developer will typically have an expectation when it should complete. When a job doesn’t complete on time – you will either get a call to look into the problem or your monitoring system will alert you that there is a long running process consuming large resources on the database server.

In either case you are now tasked with finding the root cause of a problem. And sometimes your monitoring system will give you enough details to pin point the problem (usually a single poorly written SQL). But there are cases when you need to dig deep. There could be multiple poorly performing SQL statements that are switching back and forth making it difficult to tell which one is the culprit. And in these instances SQL Trace and TKPROF really come in handy, so lets go over the whole process now.

Identify SID/SERIAL

First we need to identify the SID/SERIAL# of the job so we can enable SQL Trace on it. There are couple of ways you can do this:

OPTION-A: If your monitoring system picked up the poorly performing session SID/SERIAL# – then move on to the next step (Enable SQL Trace), otherwise choose one of the two options below.

OPTION-B: I always like to get on the actual database node and check how much damage this sessions is really doing. Most of the times the poorly performing batch job will be burning up CPU and I/O. This makes it very easy to find it using the following shell command which lists the top 10 process ids (PIDs) currently active on the server:

ps -eo pcpu,pid,user,args | sort -k 1 -r -n | head -10

the above snippet works on Linux. Here’s an equivalent for SUN Solaris:

/usr/ucb/ps -aux | head

I usually save this snippet in a file called topas and put it in my user’s personal bin directory so I can execute it without the need to remember the long syntax. BTW, the reason I call it topas is because there is a great utility on IBM AIX that does exactly this function and it’s called topas.

TIP: If you are on Oracle RAC, you will need to first identify which node the job is running on. I prefer to constrain batch jobs to run on a specific node using dedicated connections. This makes it much easier to find them later (I create a custom DB SERVICE and ask developers to use it when making connection to the database).

Here’s a sample output of the above snippet that clearly shows that the PID (4089) is the culprit we need to trace (it’s consuming the most amount of CPU on the server):

tkprof step 1 get PID on database server

Once we have the PID we can find SID using the following sql:

clear col

set head on
set pages 60
set lines 300
set trims on
set tab off

col sid             format 9999
col serial#         format 999999
col username        format a15
col machine         format a15 trunc
col osuser          format a12
col maction         format a45
col status          format a12
col spid            format a10
col process         format a10
col event           format a30 trunc
col SECONDS_IN_WAIT format 9999 heading SECW

select s.sid,s.serial#,s.username,
       s.status,s.osuser,s.machine,s.process,s.event,
       s.SECONDS_IN_WAIT,
       p.spid, s.module||' '||s.action maction
from v$session s
,    v$process p
where (s.process='&&1' OR
       s.paddr = (select addr 
                    from v$process 
                   where spid='&&1'))
and   s.paddr = p.addr;

exit;

save the above script in /tmp/pid.sql and call it from sqlplus as follows:

PID=<pid you got from topas>
sqlplus -s "/ as sysdba" @/tmp/pid.sql $PID

It should produce a report giving you the SID/SERIAL# for the batch job in question.

OPTION-C: What if you don’t know which database node the job is running on? Or, what if your DB server is so utilized by other processes that topas doesn’t put the runaway job at the top of it’s list? In this case, I ask the developers to give me the name of the machine the job was submitted from and optionally the CLIENT_IDENTIFIER they use for the process. I then use the following shell script to find the SID/SERIAL for this job:

#!/bin/ksh
# $Id: msid.sh 30 2016-01-07 23:36:07Z mve $
# Copyright 2016 HASHJOIN (http://www.hashjoin.com/). All Rights Reserved.

NODE=$1
CID=$2

if [ ${NODE}"x" == "x" ]; then
        print -n "Enter machine name: "
        read NODE
        print
fi

if [ ${CID}"x" == "x" ]; then
    CLIENT_ID=""
else
    CLIENT_ID="or s.CLIENT_IDENTIFIER like '${CID}'"
fi


sqlplus -s /nolog <<EOF
connect / as sysdba

set head on
set pages 60

set lines 300
set trims on
set tab off
col inst_id format 99 heading I#
col sid format 9999
col serial# format 999999
col username format a15
col machine format a16 trunc
col osuser format a12
col maction format a20 trunc
col spid format a10
col process format a10
col LOGON_TIME format a13
col event format a30 trunc
col seconds_in_Wait heading sw format 99999

select s.inst_id, s.sid,s.serial#,s.username,
       s.status,s.osuser,
       to_char(s.LOGON_TIME,'mon-dd hh24:mi') LOGON_TIME,
       s.machine,s.process,
       p.spid, s.module||' '||s.action maction,
       event, seconds_in_Wait
from gv\$session s
,    gv\$process p
where s.machine like '${NODE}' ${CLIENT_ID}
and   s.paddr = p.addr
and   s.inst_id = p.inst_id;
exit;

exit
EOF

save the above code in /tmp/msid.sh and then execute it as follows:

chmod +x /tmp/msid.sh
/tmp/msid.sh MACHINE CLIENT_ID

where MACHINE is a partial or full name of the machine the job was submitted from and CLIENT_ID is the value of v$session.CLIENT_IDENTIFIER that was set on the session by the developer using dbms_session.set_identifier procedure. NOTE that CLIENT_ID is completely optional – you can just use MACHINE parameter and completely omit the CLIENT_ID.

For example, lets say the hostname is dwhost01.dc.mydomain.com and CLIENT_IDENTIFIER is dw_calculate_revenue_daily_job, you can use the following call:

/tmp/msid.sh dwhost%.dc1% %calculate_revenue%

Alright! So at this point we have the SID/SERIAL#, we can finally turn the SQL Trace ON for this session. Now, let me pause here for a second and bring your attention to how much ground we already covered! And we haven’t even touched on the subject of this article – TKPROF. This just shows how much additional know-how you need before you can even touch this tool. Ok, lets continue to the next step of enabling SQL Trace.

Enable SQL Trace

In the previous section we figured out the SID/SERIAL# for the slow running batch job. And now we can finally enable SQL Trace for this session. After the SQL Trace is turned on – Oracle will write out all the waits and calls this session is doing to a trace file on the database server. We’ll then use TKPROF to analyze this trace file and generate a human readable report to review.

There are way too many options of enabling SQL Trace and for this reason I’ll only show you one way to do this – using set_ev procedure of the dbms_system package – here’s the syntax:

exec sys.dbms_system.set_ev(SID,SERIAL#,10046,12,'');

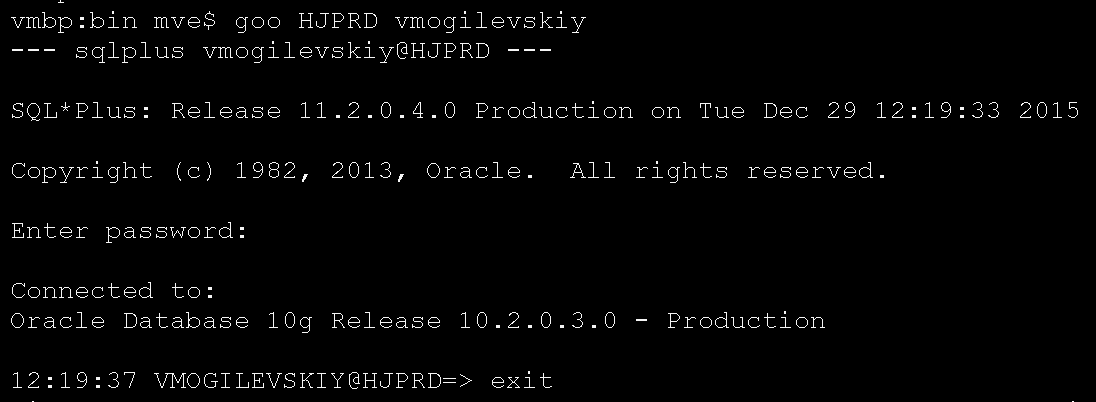
For example lets say that the SID and SERIAL# we gathered are 3927 and 22 respectively and that my DBA account on this server is vmogilevskiy. Here’s the process then:

  1. login to the database node where we found this session via sqlplus (I like to be on the db node directly because the next step is to look at the trace file).
  2. grant vmogilevskiy execute on dbms_system.
  3. connect as vmogilevskiy and call set_ev procedure giving it SID/SERIAL# as parameters.

Here’s the code:

sqlplus /nolog
connect / as sysdba
grant execute on dbms_system to vmogilevskiy;
connect vmogilevskiy;
exec sys.dbms_system.set_ev(3927,22,10046,12,'');

NOTES: Grant execute only needs to be done once, but I still wanted to list it here in case your DBA account doesn’t yet have execute privilege on dbms_system. Trace level (12) will show all bind variable in the raw trace file including recursive sql ran by SYS – that’s my preferred trace level.

Now we are finally ready to use TKPROF!

TKPROF the Trace File

In the previous step we turned on the SQL Trace and Oracle is already writing out all the waits and calls this session is doing to a trace file on the database server. Our next step is to find the trace file and run tkprof on it. This trace file will be located in the udump directory directly on the database server and part of it’s name will contain thegv$process.SPID value.

It’s also almost always the case that the trace file we are after is the last one modified in the udump directory. So running a simple ls -lta | head to list the last 10 modified files will most likely put it at the top of the list.

For example, in my sample the SPID=32262 and the trace file name is repdb_ora_32262.trc:

oracle@dwdb01~ cd /oracle/orabin/admin/repdb/udump/
oracle@dwdb01~ ls -lta | head
total 930224
-rw-r-----  1 oracle oinstall 12844373 Dec  3 15:43 repdb_ora_32262.trc
drwxr-xr-x  2 oracle oinstall   118784 Dec  3 15:41 .
-rw-r-----  1 oracle oinstall   275441 Dec  3 00:30 repdb_ora_8320.trc
-rw-r-----  1 oracle oinstall     1296 Dec  3 00:22 repdb_ora_8259.trc
-rw-r-----  1 oracle oinstall   136386 Dec  2 00:37 repdb_ora_8365.trc
-rw-r-----  1 oracle oinstall   272785 Dec  2 00:30 repdb_ora_8313.trc
-rw-r-----  1 oracle oinstall   137822 Dec  1 00:29 repdb_ora_8291.trc
-rw-r-----  1 oracle oinstall     1258 Dec  1 00:23 repdb_ora_8271.trc
-rw-r-----  1 oracle oinstall     1296 Dec  1 00:23 repdb_ora_8238.trc

And to make sure it’s the right file we can quickly take a peek at what’s being written to it using tail -f command:

oracle@dwdb01~ tail -f repdb_ora_32262.trc

Lets CTL-C out of the tail -f and run the tkprof to generate the human readable report which should give us what we are after (the top consuming SQL statements for this session). And believe it or not – to answer this question using TKPROF all you need is two parameters: trace file and output file:

tkprof repdb_ora_32262.trc repdb_ora_32262.out

Really, that’s all there is to it! Because now that we have the output file generated by tkptof (repdb_ora_32262.out) we can use a simple grep command to list the total elapsed time for each of the SQL statements. The value we are after is listed in the 4th column – see below (note: I shortened the number of columns so they fit on this screen):

oracle@dwdb01~ grep "total" repdb_ora_32262.out
Binary file repdb_ora_32262.out matches
oracle@dagdb01~ strings repdb_ora_32262.out | grep "total"
total     8002      1.63     185.22      15297      34195  
total     4002      0.65      63.31       5940      12334  
total     2001      1.86       1.83          0        386  
total     8002      0.61      31.20       4004      12705  
total    12000      0.20       0.18          0          0  
total      800      0.16       0.16          0        801  
total     2000      0.73       0.71          0        281  
total     2000      0.66       0.67          0        257  
total     2000      0.68       0.66          0        228  
total     2000      0.80       0.81          0        249  
total     4000      0.31       0.31          0       8051  
total     4000      0.05       0.05          0          0  
total       40      0.02       0.02          0          0  
total       80      1.29       1.26          0      54040  
total       87      0.00       0.00          0        122  
total       18      0.00       0.00          0         54  
total        0      0.00       0.00          0          0  
total    51032      9.74     286.44      25241     123703  
oracle@dwdb01~

And in this case the highest elapsed time is 185.22 (note: the last row with 286.44 is just a total for all sql). Armed with this information we can open the trace file using vi repdb_ora_32262.out and then search for 185.22 (/185.22) which will bring us to the following block of trace file:

tkprof top sql output example

Now that we have the top SQL for this job – we can either send our findings to the developer team or take it one step further and get an EXPLAIN plan for it to see if it’s missing an index. To get an explain plan using TKPROF simply append one more parameter to it’s call explain=username/password (NOTE: the username should have access to the objects in the sql you are after):

tkprof repdb_ora_32262.trc repdb_ora_32262_explained.out explain=user/password

this will produce an EXPLAIN PLAN next to the SQL we are after directly in the output file.

Finally, there is one last thing left to do – turn off the SQL Trace for the session – otherwise you are running a risk of consuming all space on the database server it if continues to run. To turn off SQL Trace I use the following procedure:

exec sys.DBMS_SYSTEM.SET_SQL_TRACE_IN_SESSION(sid,serial#,false);

and in this example the call would be as follows:

exec sys.DBMS_SYSTEM.SET_SQL_TRACE_IN_SESSION(3927,22,false);

And that’s all there is to it! Happy tkprof’ing! If you found this article helpful and would like to receive more like it as soon as I release them make sure to sign up to my newsletter below:

SUBSCRIBE

January 7, 2016

Posted In: Operations, Scripts

Tags: , , , ,

sqlplus -s Shell Scripting Techniques

My #1 Oracle DBA tool is sqlplus – I use it to automate DBA tasks directly on the Oracle Server from shell scripts. I often put the output of sqlplus -s in a shell variable and use it for further processing. I also wrap the sqlplus script output in a shell function and pipe it’s output to egrep filtering. These are all very powerful and useful techniques and I’ll show you how to use them in this post. And to make it easier – I’ll go over these use-cases in the context of the different ways we can invoke the sqlplus utility:

  1. sqlplus username/password@TNS_ALIAS
  2. sqlplus username@TNS_ALIAS
  3. sqlplus /nolog
  4. sqlplus / as sysdba
  5. sqlplus -s

I will focus on Linux / Unix because this is where my expertise is and where Oracle put most of it’s focus and support (Oracle EL and Solaris). I will also assume that you already have sqlplus installed and the basic connectivity to your database is configured using tnsnames.ora file. Now lets dig deep!

sqlplus user/pass@TNS_ALIAS

This is the most basic way to start sqlplus and connect to a database defined by the TNS_ALIAS in the tnsnames.ora file. This is also the most insecure way of making a connection because anyone with access to your server where you are executing this command will be able to see the values of your username and password by simply running a ps -ef | grep sqlplus from their terminal. And for this reason I don’t recommend using this format to connect to an Oracle database from a machine that is open to other users/processes.

sqlplus username@TNS_ALIAS

Here we lost the password and made our connection much more secure because no-one can sniff our password by running ps -ef | grep sqlplus from their terminal. This is the method I use to connect to a remote Oracle database from my personal Mac OS X workstation. I simply save my very long password in a TextExpander snippet and supply it when sqlplus prompts me for it:

sqlplus username with TNS ALIAS

Note that my prompt is setup to display username and TNS_ALIAS that were used to make the connection with – this makes it very convenient when you have multiple terminal sessions opened to different databases and often switch between them. I use a special script to accomplish this – it’s called login.sql and here are it’s contents:

set timing on
set tab off
set time on
SET SERVEROUTPUT ON size unlimited
WHENEVER SQLERROR CONTINUE
set sqlprompt           "_USER'@'_CONNECT_IDENTIFIER=> "
define _editor=vi
set echo on

If you save the above code in a script called login.sql and then place this script in the directory where you start sqlplus from – you’ll get the same result. I highly recommend doing this.

sqlplus /nolog

The /nolog tells sqlplus to skip the login and go directly to the sqlplus prompt where you can make a connection. I use this when calling sqlplus from a shell script directly on the Oracle database server because it allows me make a connection using connect / as sysdba and then pass sqlplus some quick commands to process.

For example here’s a quick way to dump an Oracle systemstate in order to Find which Session is Holding a Particular Library Cache Lock (the example below works on 11g and above):

sqlplus /nolog <<EOF
connect / as sysdba
oradebug dump systemstate 266
oradebug tracefile_name
EOF

In the above script we wrap sqlplus /nolog command in a shell redirection which passes all commands between EOF words to sqlplus via stdin. This technique allows you to save these quick snippets and then recall/execute them with a lightning speed. I use TextExpander for this but you can simply save these snippets in a file/script.

sqlplus / as sysdba

If your only intention is to login as sysdba once and then execute some commands directly on the Oracle Server then you can skip the /nolog option and instead use / as sysdba. The / tells sqlplus to use OS level authentication and the as sysdba tells sqlplus that you want to gain access to the Oracle server with the sysdba privileges. If we were to rewrite the previous example using this annotation here’s what it would look like:

sqlplus / as sysdba <<EOF
oradebug dump systemstate 266
oradebug tracefile_name
EOF

At this point you might be wondering why use /nolog at all? The answer lies in the sqlplus scripting where a script prompts for a username/password or when the connect credentials are already embedded inside the body of the script. In such a case you don’t want to make the initial connection to the database and instead you let the script handle it for you. After all – there would be no reason to make that initial connection only to have the script reconnect again.

sqlplus -s

The -s flag tells sqlplus to be banner silent and not prompt for any input such as username/password or variable substitution. Note however that sqlplus -s will still output the results of the sql you execute and this makes it an extremely useful option in shell scripting because we can save the output of the sqlplus -s in a shell variable! For example here’s a way to verify Oracle RAC interconnect using oradebug ipc:

output=`sqlplus -s /nolog <<EOF
connect / as sysdba
oradebug setmypid
oradebug ipc
oradebug tracefile_name
exit
EOF`

trcfile=`echo $output | awk '{print $NF}'`
grep SSKGXPT $trcfile

Here we save the output of everything that runs between the two tick marks and the EOF words in a shell variable output and then we parse it’s contents using awk’s {print $NF} which gives us the last column in the record, and that happens to be the trace file name. We then grep this trace file for a line containing SSKGXPT to get the IP address of the interconnect network in an Oracle RAC Cluster.

Here’s a more advanced example of wrapping the sqlplus -s in a shell function and then piping it’s output to a grep filter:

#!/bin/ksh

get_asm() {
$ORACLE_HOME/bin/sqlplus -s /nolog <<EOF
connect / as sysdba
col path format a35
col CREATE_DATE format a20
set lines 132
set trims on
set tab off
set pages 2000
select inst_id, DISK_NUMBER, header_status, 
       state,path,TOTAL_MB,FREE_MB,
       to_char(CREATE_DATE,'yyyy-mon-dd hh24:mi') CREATE_DATE 
from gv\$asm_disk;
EOF
}

ASMDISK=$1
if [ ${ASMDISK}"x" == "x" ]; then
    get_asm;
else
    get_asm | egrep "INST_ID|^--|${ASMDISK}"
fi

NOTE: this is a shortened version of my lasmdsk.sh script which I described last week in Oracle ASM Diagnostics Script.

Here we wrap the sqlplus -s script in a function get_asm() – at this point it’s simply defined and ready to be used, we then check if ASMDISK variable was supplied to us: if it wasn’t – we execute get_asm and let it print it’s output; on the other hand, if ASMDISK was given to us – we execute get_asm and pipe it’s output to egrep that prints all of the heading lines INST_ID|^-- plus the lines that contain the value of ASMDISK.

sqlplus wrapper script

Finally, I typically use a wrapper script when I need to execute a long running sql and have it’s output saved and emailed to me. For example, lets say we have a scriptmysql_script.sql which has a big job to insert append a lot of data from one big table to another using parallel dml – here are it’s contents:

set echo on
set time on
set timing on

ALTER SESSION SET recyclebin = OFF;
alter session set parallel_force_local=FALSE;
alter session enable parallel dml;
alter session enable parallel ddl;
select sid from v$mystat where rownum = 1;

alter table table_owner.big_target_table disable constraint btt_pk;
drop index table_owner.btt_pk;

insert /*+ append parallel(t,64) */ into table_owner.big_target_table t
select /*+ parallel(s,64)*/ * from source_owner.big_source_table s;

I then create a wrapper shell script that will let me execute above sql script safely and at the same time provide instrumentation and logging. I call this wrapper scriptexec_sql.sh – here are it’s contents:

mve$ cat ./exec_sql.sh
sqlscript=$1
sqlparams=$2
DBA=yourname@domain.com

sqlplus /nolog <<EOF
connect / as sysdba
set echo on
set feed on
set time on
set timing on
set lines 300
set trims on
set serveroutput on size unlimited
spool ${sqlscript}.log
select sid from v\$mystat where rownum = 1;
begin
    dbms_application_info.set_client_info(client_info=>'${sqlscript}');
    dbms_session.set_identifier('${sqlscript}');
    commit;
end;
/
@${sqlscript}.sql $sqlparams
spool off
exit
EOF

mailx -s "${sqlscript} done `date`" $DBA < ${sqlscript}.log

We can then call it as follows:

nohup ./exec_sql.sh mysql_script > mysql_script.hn &
tail -f mysql_script.hn

We are executing a sql script mysql_script.sql and piping it’s output to mysql_script.hn which we then start viewing “live” using tail -f. And while the above script is executing we can open another sqlplus session to the same database and execute the following sql to monitor what the script is doing or waiting for:

set lines 132
set pages 1000
set trims on
col CLIENT_IDENTIFIER format a20
col ACTION format a17
col P1TEXT format a14
col EVENT format a30

select inst_id,event,p1raw,max(seconds_in_Wait) max_wait,
       trunc(avg(seconds_in_Wait)) avg_wait,
       count(*), state
from gv$session
where CLIENT_IDENTIFIER = 'mysql_script'
  and wait_time=0
group by inst_id,event,p1raw,state
order by inst_id,event;

As soon as the script is finished the exec_sql.sh will send us an email with a subject “mysql_script done date” and pipe the log file generated by the script in the email body for our review.

And there you have it – we just went over my favorite ways to utilize sqlplus in shell scripting. Armed with these techniques you can start developing some very elaborate automation scripts in your Oracle environment. The best way to start with this is to just try something small – find a problem you need solved and slowly build a script to attack it.

Happy scripting! And if you found this writeup useful please subscribe to my newsletter and get new articles as soon as I post them:

SUBSCRIBE

December 30, 2015

Posted In: Operations, Scripts

Oracle ASM Diagnostics Script

As I mentioned in Oracle Tablespace Monitoring, I worked for a company that operated a very large internet site and our space consumption was at the rate of 800GB every month. We were adding 4x400GB LUNs to our RAC cluster every two months. And this amount of space needed to be added not only to the primary production site, but also to the snapshot DB, reporting DB and the physical standby DB in a remote datacenter. Needless to say, I’ve seen a number of multipath/storage and ASM issues and to make my life easier I developed an Oracle ASM Diagnostics Script that allowed me to perform some basic health-checks on the state of ASM GROUPs and DISKs as seen from the database side.

The script is called lasmdsk.sh and it does the following:

Check if ASM is running and parse the ASM instance ID (ASM1,2,3,n etc): check if ASM is running

Parse the ASM ORACLE_HOME from /etc/oratab using the ASM Instance ID from previous step and set up ORACLE_SID and ORACLE_HOME environmental variables accordingly: parse ASM ORACLE_HOME

Run asmcmd command and print the following attributes:

  • State
  • Type
  • Rebal
  • Sector
  • Block
  • AU
  • Total_MB
  • Free_MB
  • Req_mir_free_MB
  • Usable_file_MB
  • Offline_disks
  • Voting_files
  • Name

And finally dig deep into the ASM data dictionary joining gv$asm_disk and gv$asm_diskgroup to check for the most common issues we’ve seen in our shop while adding SAN provisioned multipath’ed LUNs to our databases: parse ASM ORACLE_HOME

However the true utility of this script is in how quickly and easily it allows me to filter the output of the above query. And to really demonstrate this – let me give you a real example of how I add new LUNs under ASM and provision them to a real production data group:

Lets say I just created four new ASM DISKs (DATA_105, DATA_106, DATA_107 and DATA_108) using sudo /etc/init.d/oracleasm createdisk command and then I didscandisks and listdisks on all RAC nodes.

Now it’s time to verify the gv$asm_disk.HEADER_STATUS = PROVISIONED. I could setup ORACLE_HOME and SID and PATH variables to point to ASM/Grid OH and then login to sqlplus and run the query selecting HEADER_STATUS from gv$asm_disk where NAME ...

hmm … do you see the problem?

I now have to use an IN or OR operator to get all 4 DISKs because there is no common pattern to give to a LIKE operator unless I use regex and who is going to do that on a fly?

Contrast this with my script instead:

wget https://s3.amazonaws.com/mve-shared/bin/lasmdsk.sh
./lasmdsk.sh “_105|_106|_107|_108”

Easy! And it works because inside the script I wrap the query in a shell function and then pipe it’s output to egrep which does the filtering faster and easier than it’s possible inside oracle:

get_asm | egrep "INST_ID|^--|${ASMDISK}"

Now I simply run ./lasmdsk.sh “_105|_106|_107|_108” , check that HEADER_STATUS = PROVISIONED and move to the next step which is creating a TEST disk group and adding the 4 new DISKs to it to make sure everything works as expected:

ASMID=`ps -ef | grep pmon | grep ASM | awk '{print $NF}' | sed 's/asm_pmon_//g'`
ORACLE_HOME=`grep ${ASMID} /etc/oratab | awk -F: '{print $2}'`
export ORACLE_HOME
PATH=$PATH:$ORACLE_HOME/bin
export PATH
ORACLE_SID=${ASMID}; export ORACLE_SID

sqlplus / as sysasm <<EOF
create diskgroup TESTGRP EXTERNAL REDUNDANCY
disk
   'ORCL:DATA_105'
,  'ORCL:DATA_106'
,  'ORCL:DATA_107'
,  'ORCL:DATA_108';
exit;
EOF

Next I mount the new TESTGRP group on the remaining nodes of the RAC cluster using another script of mine called mntgrp.sh which I previously installed on all nodes in the RAC cluster using the following method:

for x in {2..6}
do
   scp mntgrp.sh racdb0${x}:/oracle/dba/bin/
done

which now allows me to call it with mount|unmount option like so:

for x in {2..6}
do
   ssh racdb0${x} /oracle/dba/bin/mntgrp.sh TESTGRP mount
done

I then verify that the TESTGRP is mounted on all nodes in the cluster using the following:

./lasmdsk.sh TESTGRP

Next I proceed to check ASM Alert logs for any errors (actually I simply check our custom monitoring system that keeps an eye on these things) and if none found I drop the TESTGRP and assign the 4 new DISKs to the real production DISK GROUP that they were destined for. Here’s the remainder of the process:

Dismount the TESTGRP on all but first node (node where I am now):

for x in {2..6}
do
   ssh racdb0${x} /oracle/dba/bin/mntgrp.sh TESTGRP dismount
done

Take a storage level snapshot of the database (this is a scripted process so I will spare you from the details of this as it’s very specific to our environment and storage).

Once the snapshot is taken – drop the TESTGRP:

## first make sure it’s dismounted on all but this node
./lasmdsk.sh TESTGRP
## then sign into sqlplus as sysasm and issue:
drop diskgroup TESTGRP;

Verify that the HEADER_STATUS = FORMER using lasmdsk.sh:

./lasmdsk.sh “_105|_106|_107|_108”

and finally add the 4 DISKs to the real production data group as sysasm:

ALTER DISKGROUP PROD_DATA1 ADD
DISK
   'ORCL:DATA_105'
,  'ORCL:DATA_106'
,  'ORCL:DATA_107'
,  'ORCL:DATA_108';

alter diskgroup PROD_DATA1 rebalance power 10;

At this point I am almost done. I just do one more final check on the state of DISKs and GROUPs using lasmdsk.sh:

./lasmdsk.sh “_105|_106|_107|_108”

I check above output for some key things that we watch out for:

  1. gv$asm_disk.PATH doesn’t match gv$asm_disk.NAME (something terribly wrong happened at OS level, rescan or bounce to clear it up)
  2. DISK belongs to a wrong GROUP (ditto)
  3. GROUP’s state is not what it supposed to be (mount/dismount manually)
  4. DISK’s state is HUNG (should be NORMAL: Solution ALTER DISKGROUP name UNDROP DISKS)
  5. DISK’s header_status is other than MEMBER (PROVISIONED is OK for newly formatted unused/free disks)

For example – here’s an issue with CRS DISKs pointing to wrong paths (click the image to view full size): CRS DISKs pointing to wrong paths

I hope this helps you with chasing down ASM/SAN-storage issues! And if you have any questions head over to our Oracle DBA Community and simply ask.

December 22, 2015

Posted In: Operations, Scripts

Tags: , , , , , ,

Oracle Tablespace Monitoring

I carefully monitor Oracle Tablespace utilization because I don’t buy into the space is cheap mantra. It’s especially important when we are dealing with SAN/FC/FLASH based storage.  If you can effectively find the root cause of the vanishing space in an Oracle Tablespace you can save a good chunk of money for your organization and make your own life much easier by having fewer requests for new LUNs from the storage team.

Back in 2014 I was working for a company that operated a very large internet site and our space consumption was at the rate of 800GB every month, we were adding 4x400GB LUNs to our RAC cluster every two months. Then, one month we almost doubled our space consumption rate for no apparent reason. I decided that it was time to find the root cause of the issue and developed a series of scripts that helped us find the root cause in no time. I’ll show you how it works so you can adopt it in your workflow and DB monitoring.

The two scripts are:

  1. segs2: Fast Extending Segments in the last X minutes for given TS
  2. segs3: Fast Extending Segments Since Last Datafile Creation for given TS

These scripts use Oracle AWR, specifically dba_hist_seg_stat and dba_hist_seg_stat_obj so it’s important that you have a recent AWR snapshot to work with – you can easily create one using the following command:

exec dbms_workload_repository.create_snapshot();

Be careful – don’t add a call to dbms_workload_repository.create_snapshot into the actual scripts and then run it over and over again – doing so can put a strain on a busy database.

Once you have a fresh AWR Snapshot created it’s very easy to use the scripts – simply login to the Oracle DB in question via sqlplus and call the script:

For example to find which segments grew in the last 60 minutes in a tablespace DATA run segs2.sql as follows:

wget https://s3.amazonaws.com/mve-shared/segs2.sql
sqlplus / as sysdba
@segs2.sql 60 DATA

or if you are interested in what segments grew in a tablespace DATA since the last datafile was added run segs3.sql as follows:

wget https://s3.amazonaws.com/mve-shared/segs3.sql
sqlplus / as sysdba
@segs3.sql DATA

I am considering incorporating the above two scripts into the new Oracle Monitoring Framework I am developing, so if you think this is valuable – sign up for the EvenTorEx Mailing List to start the discussion and get the private beta as soon as it’s ready (no SPAM here I guarantee it!):

EvenTorEx Mailing List

December 16, 2015

Posted In: Operations, Scripts

Tags: , , ,

v$lock: Oracle Rac gv$lock Script

Here’s my #2 most used script that can detect and drill down into v$lock / gv$lock to detect Oracle’s Blocking LOCKs across an entire Oracle RAC Cluster – locks.sql. Here’s how to use it:

wget https://s3.amazonaws.com/mve-shared/locks.sql
sqlplus / as sysdba
@locks.sql

NOTE: if you don’t have wget on your system try curl instead:

curl -o locks.sql https://s3.amazonaws.com/mve-shared/locks.sql

And here’s an example of locks fully decoded across multiple instances:

-- In this example (see "blocked sessions from GV$LOCK" section) we have a case of:
--       SID-3084 on INST_ID=4 is blocking two SIDs on INST_ID=6
--
-- NOTE: "blocked objects from GV$LOCK and SYS.OBJ$" section 
--       is just an FYI of all current locks
--

17:31:45 VMOGILEVSKIY@LPROD3=> @locks.sql

blocked objects from GV$LOCK and SYS.OBJ$

   INST_ID        SID      LMODE MIN_BLOCKED BLOCKED_OBJ
---------- ---------- ---------- ----------- -----------------------------------
         3       3961          3           0 APPUSER_OWNER.DBJOBREQUESTS
         3       3866          3           0 APPUSER_OWNER.DBJOBREQUESTS
         5       3887          3           0 APPUSER_OWNER.DBJOBREQUESTS
         3       3484          3           0 APPUSER_OWNER.DBJOBREQUESTS
         3       3161          3           0 APPUSER_OWNER.DBJOBREQUESTS
         3       2998          3           0 APPUSER_OWNER.DBJOBREQUESTS
         3       2979          3           0 APPUSER_OWNER.DBJOBREQUESTS
         3       2752          3           1 APPUSER_OWNER.DBJOBREQUESTS
         3       2618          3           0 APPUSER_OWNER.DBJOBREQUESTS
         3       2610          3           0 APPUSER_OWNER.DBJOBREQUESTS
         3       2456          3           0 APPUSER_OWNER.DBJOBREQUESTS
         3       2368          3           0 APPUSER_OWNER.DBJOBREQUESTS
         3       2243          3           0 APPUSER_OWNER.DBJOBREQUESTS
         3       2134          3           0 APPUSER_OWNER.DBJOBREQUESTS
         3       2132          3           0 APPUSER_OWNER.DBJOBREQUESTS
         6       3854          3           0 APPUSER_OWNER.DBJOBREQUESTS
         6       3507          3           0 APPUSER_OWNER.DBJOBREQUESTS
         6       3417          3           0 APPUSER_OWNER.DBJOBREQUESTS
         6       3303          3           0 APPUSER_OWNER.DBJOBREQUESTS
         6       3222          3           1 APPUSER_OWNER.DBJOBREQUESTS
         6       3135          3           0 APPUSER_OWNER.DBJOBREQUESTS
         6       2804          3           0 APPUSER_OWNER.DBJOBREQUESTS
         6       2786          3           0 APPUSER_OWNER.DBJOBREQUESTS
         4       3818          3           0 APPUSER_OWNER.DBJOBREQUESTS
         4       2869          3           0 APPUSER_OWNER.DBJOBREQUESTS

25 rows selected.

Elapsed: 00:00:00.03
blocked sessions from GV$LOCK

   INST_ID BLOCKER_SID    INST_ID BLOCKED_SID MIN_BLOCKED    REQUEST
---------- ----------- ---------- ----------- ----------- ----------
         4        3084          6        3135           0          6
         4        3084          6        3485           0          6

2 rows selected.

Elapsed: 00:00:00.02
blocked session details from GV$SESSION and GV$SQLTEXT

Instance........ :          6
Sid ............ :       3135
Serial ......... :      30604
Username ....... : APP1USER_NAME
SQL Id ......... : null
Prev SQL Id .... : gm424t8fyx3w6
Displayed SQL Id : gm424t8fyx3w6
Client Info .... : null
Machine ........ : dbt4.dc1.mydomain.com
OSuser ......... : dbt
Process ........ : 1234
Action ......... : JDBC Thin Client
SQL_TEXT
----------------------------------------------------------------------
select this_.WorkRequestId as WorkRequ1_1_0_, this_.CreateTime a
s CreateTime1_0_, this_.Event_Type as Event3_1_0_, this_.Status
as Status1_0_, this_.UserId as UserId1_0_ from DBJOBREQUESTS thi
s_ where this_.WorkRequestId = :1  and this_.Status=:2  for upda
te

Instance........ :          6
Sid ............ :       3485
Serial ......... :      45149
Username ....... : APP1USER_NAME
SQL Id ......... : null
Prev SQL Id .... : gm424t8fyx3w6
Displayed SQL Id : gm424t8fyx3w6
Client Info .... : null
Machine ........ : dbt5.dc1.mydomain.com
OSuser ......... : dbt
Process ........ : 1234
Action ......... : JDBC Thin Client
SQL_TEXT
----------------------------------------------------------------------
select this_.WorkRequestId as WorkRequ1_1_0_, this_.CreateTime a
s CreateTime1_0_, this_.Event_Type as Event3_1_0_, this_.Status
as Status1_0_, this_.UserId as UserId1_0_ from DBJOBREQUESTS thi
s_ where this_.WorkRequestId = :1  and this_.Status=:2  for upda
te

10 rows selected.

Elapsed: 00:00:09.33
blocker session details from GV$SESSION and GV$SQLTEXT (current or previous SQL)

Instance........ :          4
Sid ............ :       3084
Serial ......... :       8911
Username ....... : APP1USER_NAME
SQL Id ......... : null
Prev SQL Id .... : 629vx81ykvhpp
Displayed SQL Id : 629vx81ykvhpp
Client Info .... : null
Machine ........ : dbt1.dc1.mydomain.com
OSuser ......... : dbt
Process ........ : 1234
Action ......... : JDBC Thin Client
SQL_TEXT
----------------------------------------------------------------------
update DBT_LOCK set FINISHED=:1 , VERSION=:2  where USER_ID=:3
and VERSION=:4

2 rows selected.

Elapsed: 00:00:10.13

This script presented few performance challenges because a self-join query against gv$lock joined with sys.obj$ to get a list of blocked objects is very expensive in a cluster environment, in fact it’s expensive even in a single instance environment. We also have to join gv$session with a result of self-join query against gv$lock in order to get the SQL_TEXT of the sessions doing blocking and being blocked – that’s extremely slow as well.

To solve the above performance challenges I created two tables and indexed them appropriately:

GV$ Table COPY Table Indexed Columns
gv$lock gv_lock_mon type,block
gv$session gv_session_mon inst_id,sid


Once that was done it was a simple matter of replacing GV$ Table name with COPY Table name on the key joins and performance shot up through the roof. In fact, it was so lightweight that I created a custom event in my monitoring system and started to trap occurrences of these DB blocks for historical purposes so that when a developer came to our team and asked us if there were any DB locks/blocks 3 hours ago we could simply review our alerts and answer that question with authority providing exact details on the race condition that caused these blocks. This was much more helpful then the generic alert email we’d get from OEM stating that session XYZ is blocking this many sessions on instances 1,4 and 5 for example.

My question to you is how do you monitor Oracle LOCKs? Is OEM alerting sufficient for your needs? Do you think a solution such as the one I outlined above would be beneficial to your team? I am considering adding the Oracle LOCK Monitoring feature to the Oracle Event Monitoring Framework I am developing. If you think it’s a good idea then let me know by joining the EvenTorEx Mailing List and I’ll notify you on the progress and when the private beta becomes available.

EvenTorEx Mailing List

December 9, 2015

Posted In: Operations, Scripts

Tags: , , ,

Oracle ASH Monitoring

I have over 60 Oracle diagnostic SQL scripts in my arsenal.  A lot of them hit ASH and AWR.  I’ve tested these scripts on a high traffic web-site backed by an 6 node Oracle RAC Cluster.  Everyone of these scripts saved my day at one point, but there is one script that stands out from them all – Oracle ASH Top Waits Script: h1.sql.

Oracle ASH Top Waits

This little gem is the #1 thing I reach for when I am asked to troubleshoot a performance problem that was reported hours ago. For example lets say it’s 9:30am and I get a call from a dev saying that her APEX web application is hanging – she suspects a locking issue. All I need to know at this point is when the problem was first reported – armed with the start time (lets say 7:00am) I simply do this:

sqlplus / as sysdba
@h1 0700 0930 0 -1 -1

What’s happening here? There are 5 parameters:

1: start HHMI     [0700 = 7:00am]
2: end HHMI       [0930 = 9:30am]
3: days back      [0 = today; or 7 = seven days back]
4: instance       [1 = INST_ID=1, give -1 for all]
5: service_hash   [1225919510 = dba_services.name_hash, give -1 for all]

and here’s what I get back:

Oracle ASH Top Waits Script output sample

Can you spot the problem? It’s “SQL*Net message from dblink”, there are no locks – it’s a simple problem of a badly written distributed query that is waiting on remote DB. That was easy! One other hidden benefit of this script is that it saves it’s output in a table under a RUN_ID (in this case RUN_ID=81) allowing you to compare the output of two RUN_IDs and clearly spot the differences in values grouped by WAIT EVENT. This is extremely valuable especially when someone says – “this used to work last week!”, you simply do this:

sqlplus / as sysdba
@h1 0700 0930 7 -1 -1

The “7” in the third parameter instructs the script to look 7 days back for the same time frame (7-9:30am). The output of the above report will have it’s own RUN_ID=82 (next in sequence) and you can now compare the two using a special script h1d.sql like so:

@h1d 81 82

We didn’t need OEM or any GUI apps to get to the bottom of the problem – all because the diagnostics data is already in AWR tables and is available to us directly from command line / sqlplus. Years ago – we’d have to sample v$session_wait to get similar diagnostics, in fact, I wrote a complete monitoring system that utilized such technique. But now, Oracle built this into the core engine in a form of Active Session History (ASH) that automatically samples this data every second with practically no overhead to the database! That is an incredible level of instrumentation available to us and it would be a shame not to utilize it beyond what the OEM reports are capable of.

Note however that ASH sampling is short lived – only 1/10th of it’s sampling is saved in AWR based on some internal thresholds Oracle came up with. Now imagine that we:

  1. Take a script like h1.sql and refactor it to use ASH instead of AWR because ASH samples are at higher fidelity (AWR only get’s 1/10th of ASH data).
  2. Run this script every 3 minutes to capture the live heartbeat of the database.
  3. Define your own thresholds on top of this sampling and get notified if something is amiss.
  4. Save all this data for historical purposes so that even if AWR gets wiped out you have solid performance metrics years later.
  5. Wrap this all up in an easy to deploy (single binary) distribution which only takes a minute to install on a new host.

Are you interested? Does this sound like something you’d like in your shop? If yes – then I’d like to get some feedback from you because I am building it! Sign up for the EvenTorEx Mailing List to start the discussion and get the private beta as soon as it’s ready (no SPAM here I guarantee it!):

EvenTorEx Mailing List

December 2, 2015

Posted In: Operations, Scripts

Tags: , ,

raccheck 2.2 beta released

raccheck 2.2 beta released
v. 2.2.0 Beta

Support for Single Instance Configurations (i.e., no longer limited to RAC configurations)
High Availability (HA) Best Practices
New checks and bug fixes

This new version was prodiced with collaboration with ORACLE HA team in Support to add their Top 20 checks for common problems related to backup and recovery and Data Guard. These new checks augment the MAA Scorecard. These new checks can be obtained with the following syntax:

./raccheck -r – includes the standard health checks as well as HA checks.
./raccheck -c hacheck -o -v – abbreviates the report output to ONLY the HA related checks

raccheck can be downloaded from RACcheck – RAC Configuration Audit Tool (Doc ID 1268927.1)

CREDIT: Bob Caldwell

November 2, 2012

Posted In: Data Guard, Installs, RAC, RMAN, Scripts

Tags: , , ,